How-to: use the asaplib library
Example on quick analyisis of atomic coordinates using a SOAP based metric
import numpy as np
%matplotlib inline

import asaplib
load structures
from asaplib.data import ASAPXYZ
asapxyz = ASAPXYZ('P-20GPa/result-complete/combined.xyz', periodic=True) # periodic=False otherwise

# load the tags (optional, you can use these to annotate the structures)
tags = np.loadtxt("P-20GPa/result-complete/ranking-complete", dtype="str")
#  import some reference order parameter for the structures
enthalpy = np.array(tags[:,3],float)
compute SOAP descriptors
# specify the parameters
soap_spec = {'soap1': {'type': 'SOAP',
                       'cutoff': 4.0,
                       'n': 6,
                       'l': 6,
                       'atom_gaussian_width': 0.5,
                       'crossover': False,
                       'rbf': 'gto'
                      }
            }

reducer_spec = {'reducer1': {
                          'reducer_type': 'average', # [average], [sum], [moment_average], [moment_sum]
                          'element_wise': False}
               }

desc_spec = {'avgsoap': {
                  'atomic_descriptor': soap_spec,
                  'reducer_function': reducer_spec}
            }
# compute atomic descriptors only
asapxyz.compute_atomic_descriptors(desc_spec_dict=soap_spec,
                                    sbs=[],
                                    tag='tio2-atomic',
                                    n_process=1)
# if you want to retrieve the atomic descriptors computed earlier
dm_atomic = asapxyz.fetch_computed_atomic_descriptors(['soap1'])
# compute descriptors for the whole structures
asapxyz.compute_global_descriptors(desc_spec_dict=desc_spec,
                                    sbs=[],
                                    keep_atomic=False, # set to True to keep the atomic descriptors
                                    tag='tio2',
                                    n_process=4)
# can use asapxyz.fetch_computed_atomic_descriptors(['soap1']) if keep_atomic=True
Build a kernel Matrix
reduce_dict = {}
reduce_dict['kpca'] = {"type": 'SPARSE_KPCA',
                        'parameter':{"n_components": 10,
                                     "n_sparse": -1, # no sparsification
                                "kernel": {"first_kernel": {"type": 'linear'}}}}
kernel PCA on environmental similarity
from asaplib.reducedim import Dimension_Reducers
dreducer = Dimension_Reducers(reduce_dict)
dm = asapxyz.fetch_computed_descriptors(['avgsoap'])
proj = dreducer.fit_transform(dm)
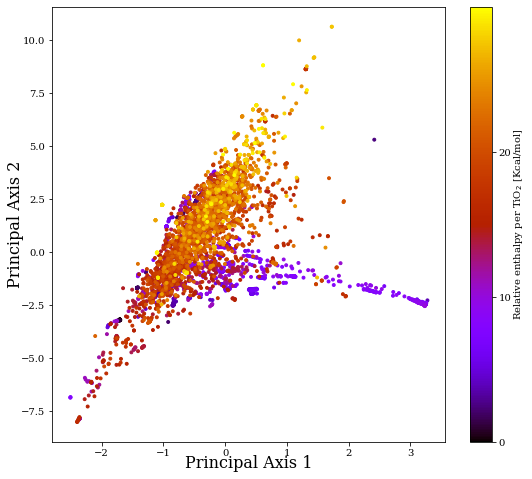
Plot the result
from asaplib.plot import Plotters
fig_spec = { 'outfile': None,
                'show': False,
                'title': None,
                'size': [8*1.1, 8],
                'cmap': 'gnuplot',
                    'components':{
                    'first_p': {'type': 'scatter', 'clabel': 'Relative enthalpy per TiO$_2$ [Kcal/mol]',
                                'vmin':None, 'vmax': None}
                    #'second_p': {"type": 'annotate', 'adtext': False} # for annotation
                    }
                   }

asap_plot = Plotters(fig_spec)

plotcolor = enthalpy[:]
asap_plot.plot(proj[:, [1,0]], plotcolor)
# one can use asap_plot.plot(proj[:, [1,0]], plotcolor, tags) to annotate the structures using the tags
Using scatter plot ...
